Imagine you could literally peek into the minds of your customers and prospects!
What if you could see what they think and feel when interacting with your business? How would that change how you market, sell, and serve them?
This extraordinary power lies within your reach, thanks to CRM metrics.
These metrics are the crucial data points that show how effective your marketing, sales, and customer support efforts are in generating and closing deals, retaining customers, and increasing revenue.
However, not all CRM metrics are created equally.
Some are more important and relevant than others. And some are easier to track and analyze than others.
In this blog post, we show you the 14 best CRM metrics for business success. We also explain what they are, why they matter, and how to track them using the best CRM software tools.
What Are CRM Metrics
CRM metrics are key data points that provide insights into the performance and outcomes of customer relationship management (CRM) strategies and activities. These metrics clearly measure various aspects of the customer journey, such as customer acquisition, retention, satisfaction, and overall engagement.
By analyzing CRM metrics, you can gauge the effectiveness of your relationship management efforts, identify areas for improvement, and make data-driven decisions to drive organizational success.
For example, you can use the retention rate metric to assess customer retention. By incorporating it into a quarterly report, you can analyze trends and patterns of customer loyalty over time.
Integrating this metric into your CRM system ensures real-time monitoring of changes, allowing you to stay updated on customer retention performance and make timely adjustments to enhance loyalty and satisfaction.
Let’s now explore various CRM metrics in the subsequent sections.
What Are the Types of CRM Metrics
If you’re looking to understand the types of CRM metrics that really matter, let’s break them down. Here are the key ones you should keep an eye on:
1. Customer Acquisition Cost (CAC)
This metric tells you how much you’re spending to bring in new customers. It includes everything—marketing expenses, sales efforts, and advertising costs. By keeping your CAC low, you can ensure you’re gaining customers without overspending. For example, if you spent $10,000 and gained 50 customers, your CAC is $200. Regularly tracking this can help you plan budgets better and improve the efficiency of your acquisition strategies.
2. Customer Lifetime Value (CLV)
CLV is about the total revenue a customer brings over their entire relationship with your business. It’s like figuring out how valuable a customer really is. For instance, if a customer spends $100 monthly and stays for two years, their CLV is $2,400. This helps you focus on nurturing high-value customers and balancing acquisition costs. A higher CLV means better long-term profitability.
3. Customer Retention Rate
This measures how well you’re keeping your customers. A high retention rate means customers are sticking around, which is always a good sign. Let’s say you start with 100 customers, and 90 are still with you after a year—that’s a 90% retention rate. Keeping customers costs less than acquiring new ones, so it’s smart to invest in loyalty programs and personalized experiences.
4. Net Promoter Score (NPS)
NPS gauges how likely your customers are to recommend your business. It’s often calculated through a simple question: “How likely are you to recommend us to a friend?” Responses help you identify promoters, passives, and detractors. High scores mean happy customers who could drive referrals. Use this to improve weak areas in your services and turn detractors into loyal supporters.
5. Sales Conversion Rate
This metric measures how many leads actually turn into paying customers. For example, if 50 out of 200 leads convert, your conversion rate is 25%. This tells you how effective your sales team is. Monitoring this can help you tweak your sales process or focus more on high-quality leads, ensuring you’re not wasting time or resources.
6. Churn Rate
The churn rate shows the percentage of customers who stop doing business with you during a specific period. For example, if you lose five customers out of 100 in a month, your churn rate is 5%. A high churn rate signals dissatisfaction, so it’s a cue to dig into what’s causing it—whether it’s pricing, product quality, or competition—and take action to retain customers.
7. Customer Satisfaction Score (CSAT)
CSAT measures how happy your customers are with your product or service. You typically collect this through short surveys after a purchase or interaction. For instance, ask, “How satisfied are you with your experience?” on a 1-5 scale. High CSAT scores mean you’re meeting customer expectations, while lower scores highlight areas where you need improvement.
8. Average Revenue Per User (ARPU)
ARPU helps you see how much revenue each customer generates on average. It’s calculated by dividing your total revenue by the number of customers. For example, if your revenue is $50,000 and you have 500 customers, your ARPU is $100. This metric is crucial for understanding your business’s earning potential and spotting opportunities to upsell or cross-sell.
What Are the Benefits of CRM Metrics
Customer relationship management metrics are crucial because they help quantify and analyze the data gathered from customer interactions. By tracking CRM metrics, you can –
- Measure the overall performance of your marketing, sales, and customer service efforts.
- Predict future revenue based on the conversion rate and value of leads.
- Identify high-ticket opportunities and focus on the most profitable customers.
- Improve customer satisfaction and loyalty by understanding their needs and preferences.
- Reduce customer churn and increase retention by providing better service and support.
- Optimize the sales pipeline by knowing which stages need more attention and improvement.
- Monitor staff performance and provide feedback and coaching to improve their skills.
6 CRM Metrics for Sales Effectiveness
Some CRM metrics that can work as powerful indicators of sales effectiveness are listed below.
1. Sales Cycle Length
It’s about how long it takes to close a deal from the first contact to the final purchase. This metric shows how efficient and fast your sales process is.
A short sales cycle length means you are moving your leads through the pipeline quickly and closing deals faster. A long sales cycle length means you may need to streamline the stages of your sales, overcome objections, or provide more value to your prospects.
❓Did You Know

The average sales cycle length for B2B companies is around 102 days.
2. Conversion Rate
Conversion rate is the percentage of leads who become customers after going through your sales process. It shows how well you move your leads through the sales funnel and persuade them to buy from you.
A high conversion rate means providing a smooth and satisfying customer journey and addressing their pain points and objections. A low conversion rate means you may need to improve your lead nurturing, follow-up, or closing skills.
Conversion rate = (Number of customers / Number of leads) x 100
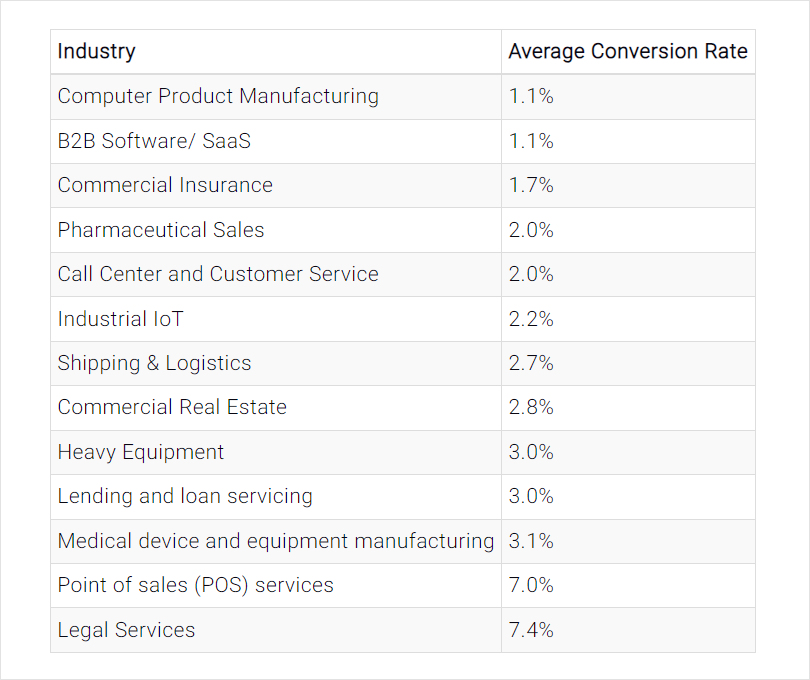
Here’s the average conversion rate for various industries that can serve as benchmarks for your business:
3. Customer Lifetime Value (CLV)
Lifetime value indicates a customer’s total revenue over their relationship with you. This metric shows how much value you create for your customers and how loyal they are to your business.
A high CLV means you are effectively providing a great customer experience and upselling or cross-selling. A low CLV means you may need to improve your customer retention, satisfaction, or loyalty strategies.
CLV = (Average purchase value x Average purchase frequency) x Average customer lifespan
4. Customer Acquisition Cost (CAC)
CAC calculates the total cost incurred by a business to acquire a new customer. It includes expenses related to marketing campaigns, advertising, sales personnel, and other activities aimed at acquiring customers.
By dividing the total acquisition costs by the number of new customers, you can know the effectiveness of your acquisition strategies. Lowering CAC is essential for optimizing profitability and ensuring a healthy ROI.
CAC = (Total marketing and sales costs / Number of new customers)
5. Net Promoter Score (NPS)
NPS, or Net Promoter Score, is a widely used metric that measures customer loyalty and satisfaction. It involves a simple question: “On a scale of 0-10, how likely are you to recommend our product/service to others?” Based on responses, customers are categorized as promoters, passives, or detractors, providing businesses insight.
A high NPS means you have many promoters who love your brand and spread positive word-of-mouth. A low NPS means you have many detractors who are unhappy with your brand and may damage your reputation.
NPS = (Percentage of promoters – Percentage of detractors) x 100
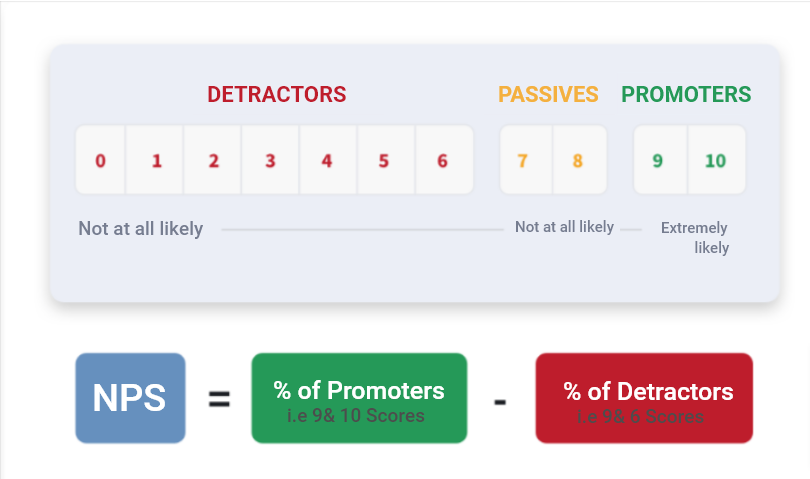
Net promoter score is a measure of customer loyalty. This graphic shows how many customers are promoters, passives, and detractors.
6. Churn Rate
The churn rate is the percentage of customers who stop doing business with you over a given period. It reflects the loss of sales revenue resulting from customer attrition.
Monitoring and analyzing churn rates help sales teams identify potential issues, such as product dissatisfaction or competition, allowing them to proactively retain customers, increase sales, and improve overall performance.
Churn rate = (Number of customers lost / Number of customers at the start) x 100
3 Essential CRM Metrics for Measuring Marketing Effectiveness
The following are key metrics for measuring and enhancing your marketing performance.
1. Lead Generation Rate
This is the percentage of visitors who become leads after interacting with your marketing content. This metric shows how well you capture your target audience’s attention and interest and generate qualified leads.
A high lead generation rate means you are delivering relevant and valuable content to your visitors. A low lead generation rate means you may need to improve your content quality, landing page design, or call-to-action.
Lead generation rate = (Number of leads / Number of visitors) x 100
2. Revenue Generated by Campaign
The revenue generated by a campaign is a vital marketing metric that measures the financial impact of a specific marketing initiative. It quantifies the amount of money generated directly from the campaign, providing insights into its effectiveness and return on investment.
This metric helps marketers evaluate the campaign’s impact on sales, customer acquisition, and overall revenue growth. Marketers can make data-driven decisions by analyzing the revenue generated, optimizing future campaigns, allocating resources more effectively, and ultimately driving business growth and profitability.
Revenue generated by campaign = (Number of sales from campaign x Average sale value) – Campaign cost
3. Email List Growth Rate
A change in your email list size over a given period shows how well you build and maintain your email list, which is a valuable asset for marketing and communication.
A high email list growth rate means you generate more leads and subscribers interested in your brand and content. A low email list growth rate means you may need to improve your lead generation, opt-in, or retention strategies.
Email list growth rate = ((Number of new subscribers – Number of unsubscribers) / Number of original subscribers) x 100
5 CRM Metrics for Customer Support Success
Here are the 5 most crucial CRM metrics that can demonstrate the effectiveness of your customer support operations.
1. Average Time to Resolution
The average time it takes to resolve a customer issue or request from the first contact to the final solution shows how efficient your customer support team is.
A lower average time to resolution suggests quicker and more satisfactory customer service, leading to improved customer satisfaction. Monitoring this metric helps identify areas for improvement, optimize support processes, and ensure the timely resolution of customer issues.
Average time to resolution = (Sum of all resolution times / Number of resolved issues)
2. Follow-Ups Per Ticket
This is the average number of interactions or contacts required to resolve a customer issue or request. This metric shows how complex and difficult your customer issues are and how well your customer support team handles them.
A low average number of follow-ups per ticket means you are resolving customer issues with minimal back-and-forth and hassle. A high average number of follow-ups per ticket means you may need to improve your problem-solving, communication, or escalation skills.
Average number of follow-ups per ticket = (Sum of all follow-ups / Number of resolved issues)
3. First Contact Resolution Rate
This metric demonstrates the percentage of customer issues or requests resolved on the first contact or interaction. It shows how effective and satisfactory your customer support service is.
A high first-contact resolution rate means you are providing a positive and convenient customer experience and reducing the need for further contacts or follow-ups. A low first contact resolution rate means you may need to improve your support quality, knowledge, or tools.
First contact resolution rate = (Number of issues resolved on first contact / Number of resolved issues) x 100
4. Customer Satisfaction Score (CSAT)
CSAT provides insights into how well customer support meets customer expectations. Monitoring this metric over time allows you to track trends, identify patterns, and make data-driven decisions to enhance customer satisfaction.
You can send CSAT surveys after a support interaction or at regular intervals. They help identify areas where the company’s support is excelling or falling short, enabling you to take corrective actions and improve the overall support experience.
CSAT = (Number of satisfied customers / Total survey responses) * 100
5. Customer Effort Score (CES)
CES aims to minimize customer effort and streamline the support experience. By measuring CES, organizations can identify pain points, bottlenecks, and areas where customers face unnecessary challenges.
The lower the CES score, the better, as it indicates that support interactions are seamless, efficient, and require minimal effort from the customer. Addressing high CES scores can improve customer loyalty, reduce churn, and increase customer satisfaction.
CES = (Total sum of effort scores / Total number of respondents)
How These CRM Metrics Work
So now we know different CRM metrics, but how do they work? It’s time to delve into this.
The wealth of information stored in your CRM system is the foundation for generating and monitoring essential CRM performance metrics. These metrics CRM systems rely on help collect, analyze, and interpret customer interactions and business activity data.
1. Data Collection
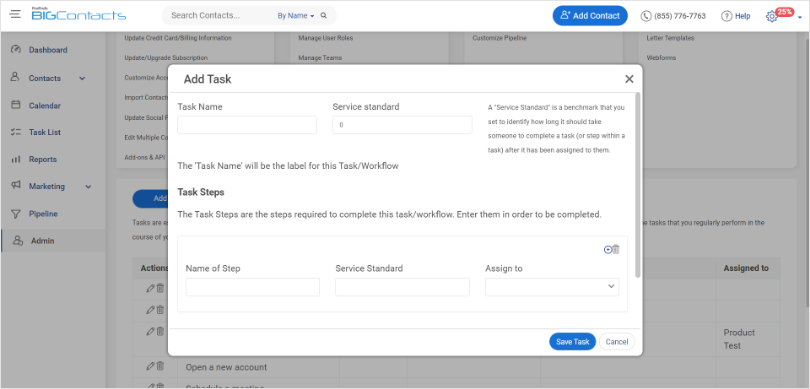
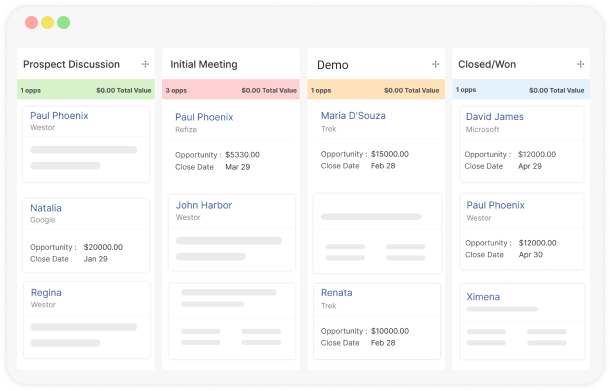
CRM software automatically tracks and captures data from various touchpoints, including customer interactions, sales transactions, marketing campaigns, and customer support activities. Team members can also manually input relevant data into the CRM system.
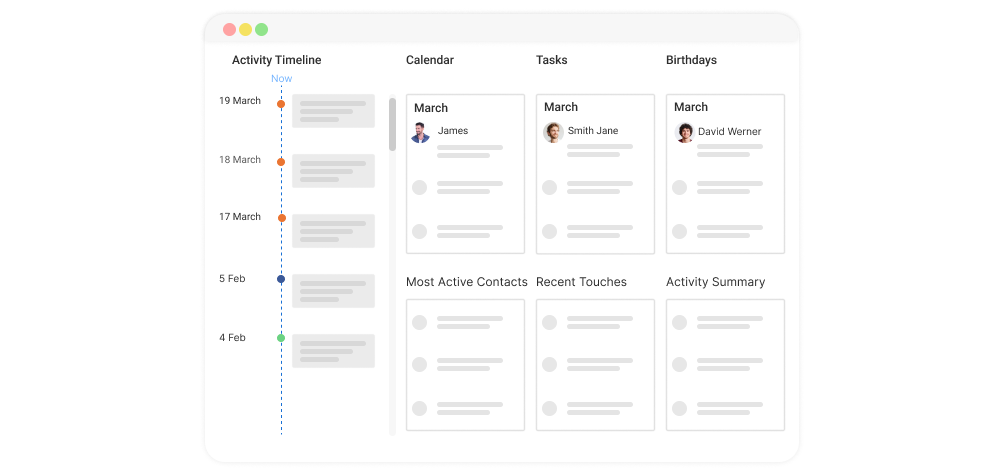
BigContacts CRM dashboard helps businesses track the data collection of various prospects.
2. Metric Calculation
Based on the collected data, CRM systems calculate specific metrics essential for evaluating performance and measuring outcomes. These metrics can range from customer acquisition and retention rates to conversion rates, customer satisfaction scores, and revenue growth.
3. Reporting & Analysis
Data is analyzed to gain insights into customer behavior, sales performance, marketing effectiveness, and overall business success. Reports and dashboards visually represent these data, summarizing key metrics to facilitate data-driven decision-making.
4. Performance Evaluation
With CRM performance evaluation, you can assess the effectiveness of your strategies and initiatives. Metrics highlight areas of improvement and identify patterns or trends that impact customer relationships, sales productivity, and customer satisfaction.
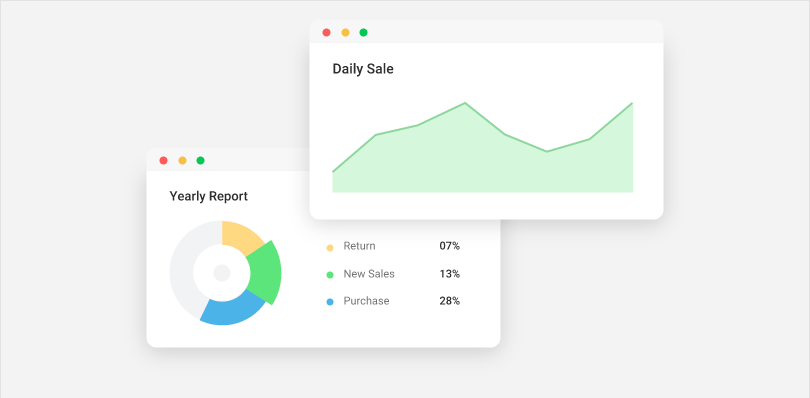
The graph shows the daily sales of the product, and the pie chart shows the yearly sales of the product.
4. Actionable Insights
The insights from CRM metrics enable businesses to make informed decisions to enhance customer relationships, optimize sales and marketing strategies, improve customer service, and drive business growth.
Importance of Tracking CRM Metrics
By monitoring customer relationship management metrics, you can make smarter decisions, improve customer satisfaction, and boost revenue. Let’s dive into why tracking these metrics is so crucial.
1. Improves Customer Experience
When you track metrics, you understand your customers’ needs better. For example, customer satisfaction scores can reveal whether your support team is meeting expectations. With this data, you can fine-tune your processes, ensuring customers feel valued and heard. Happy customers mean higher retention rates and glowing referrals, which is a win-win for everyone.
2. Drives Data-Backed Decisions
Metrics take the guesswork out of decision-making. Whether it’s knowing where to spend your marketing budget or identifying your most profitable customers, CRM metrics provide clarity. For instance, tracking sales conversion rates helps you figure out which campaigns drive results so you can double down on what works.
3. Boosts Team Performance
Keeping track of CRM metrics isn’t just about customers; it’s also about your team. Metrics like average response time or deal closure rates highlight strengths and areas for improvement. This data allows you to provide targeted training or set realistic goals, helping your team perform at their best.
4. Identifies Revenue Opportunities
CRM metrics reveal upselling or cross-selling opportunities you might otherwise miss. For example, analyzing customer purchase history can help you identify trends and recommend relevant products or services. This not only increases revenue but also strengthens customer loyalty.
5. Tracks Business Growth
Metrics help you monitor progress and ensure you’re moving in the right direction. For instance, tracking customer acquisition costs alongside customer lifetime value provides insights into whether your growth strategies are sustainable. Regularly analyzing these metrics keeps you focused on long-term success.
6. Reduces Churn Rates
By tracking metrics like customer retention and churn rates, you can spot early signs of dissatisfaction. If you notice an increase in churn, you can take proactive steps—like reaching out to unhappy customers or offering loyalty incentives—to win them back. This saves you money and strengthens your customer base.
How to Choose the Right CRM Metrics for Your Business Goals
Different CRM metrics can align with specific business goals and objectives, enabling companies to track progress and make data-driven decisions. Here’s a framework for selecting relevant and impactful CRM metrics:
1. Identify Business Goals
Refine your primary objectives by strategically identifying key areas of focus, such as increasing revenue, reducing cost, elevating customer satisfaction, or expanding market dominance. For instance, when determining CRM metrics for a small business, envision the ultimate objective, such as maximizing profitability.
2. Analyze Key Drivers
Identify the key factors that drive the achievement of your business goals. Revenue growth could be measured by lead conversion rate, average deal size, or customer lifetime value. For cost reduction, metrics like customer acquisition cost or support resolution time are crucial.
3. Assess Data Availability
Evaluate the availability and quality of data required to measure the identified metrics. Ensure access to necessary data and track them within your CRM system. Keep your CRM data clean with regular audits and updates.
4. Prioritize Impactful Metrics
Prioritize metrics that directly impact your business goals and objectives. Choose metrics that provide actionable insights and allow you to monitor progress toward achieving your desired outcomes.
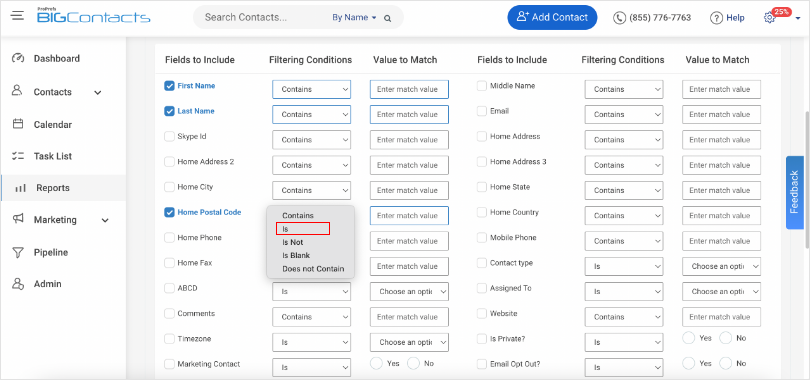
5. Customize CRM Reports
Leverage a robust CRM tool like BIGContacts to customize reports and dashboards based on your specific business needs. Tailor the reporting capabilities to track the selected CRM metrics, allowing you to monitor performance and make informed decisions.
Remember, the selection of CRM metrics should align with your unique business goals and the specific outcomes you wish to achieve.
How to Set up CRM Metrics in Your Software
A powerful CRM system will make monitoring and reporting on the most influential metrics easy. To set up the metrics of your interest in your CRM software, you must –
1. Map Your Customer Journey
Identify the stages and touchpoints your customers go through, from awareness to conversion, and align them with your business and sales goals.
2. Define Your Business Processes
Establish the workflows and tasks your teams need to perform at each stage of the customer journey and assign roles and responsibilities accordingly.
3. Create Custom Fields, Stages & Pipelines
Customize your CRM software to capture and display relevant data to your business and sales processes, such as contact information, deal value, lead source, etc. You can also create multiple pipelines for different types of deals or customers.
4. Migrate Your Customer Information
Import your existing customer data from other sources, such as spreadsheets, emails, or other software tools, into your CRM software. Make sure to clean and update your data before and after the migration to ensure accuracy and consistency.
5. Integrate Other Tools
Connect your CRM software with other tools you use for marketing, sales, and customer service, such as email, social media, chat, phone, etc. This will help you streamline communication and data sharing across platforms.
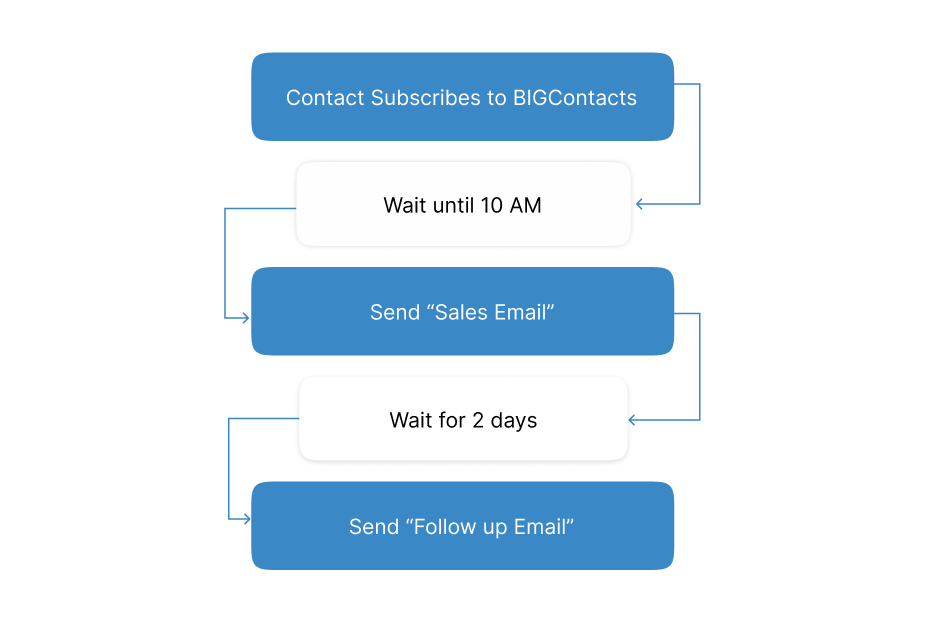
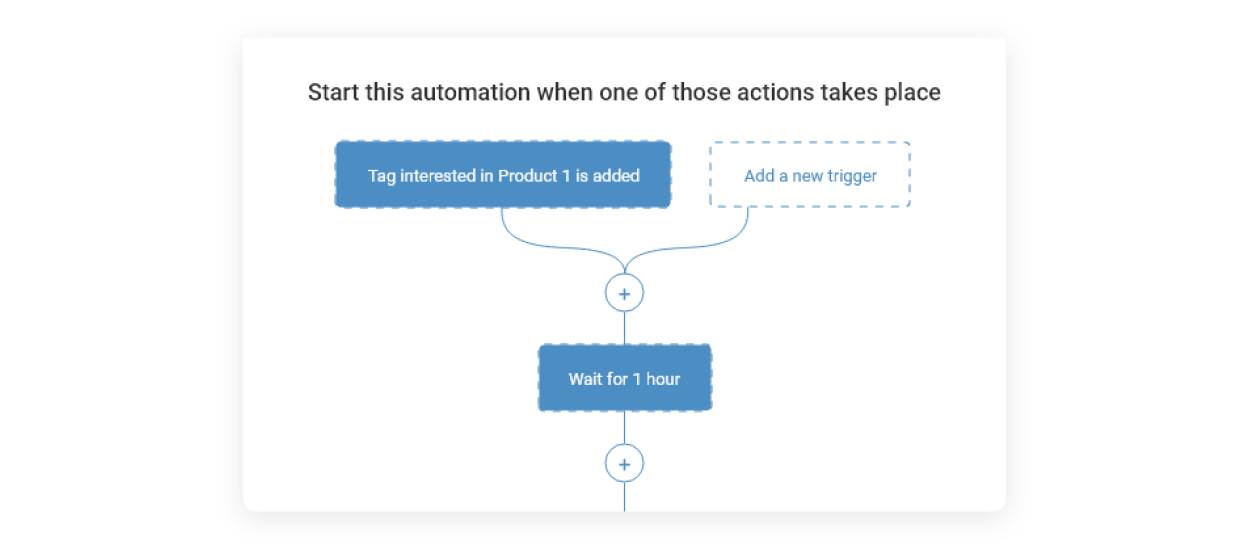
6. Automate Manual Tasks
You can also use automation features to trigger actions based on certain criteria or events, such as sending email campaigns, creating tasks, updating records, etc.
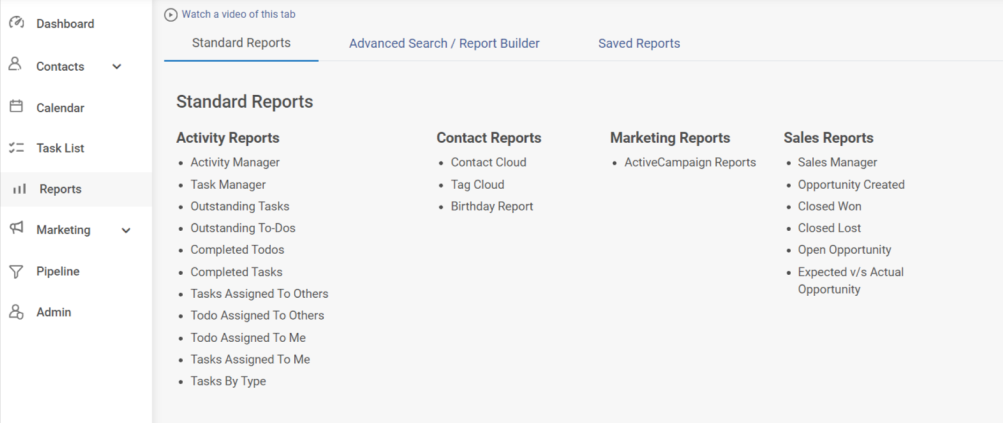
7. Use Reports & Dashboards
Generate detailed reports and dashboards to visualize and analyze your CRM metrics and gain insights into your business performance and customer behavior.
8. Set User Permissions
Invite your team members to use your CRM software and assign them different levels of access and visibility based on their roles and responsibilities. You can also create groups or teams to facilitate collaboration and reporting.
Unlock the Power of Your CRM Data
CRM metrics provide a solid quantitative framework to evaluate and enhance customer relationship management efforts. They enable you to better understand customer needs, align with their expectations, and achieve your organizational goals effectively. By focusing on CRM success metrics, you can identify what’s working and make smarter, data-driven decisions.
To maximize the potential of these metrics, you need a robust platform that simplifies tracking, enhances customer relationships, and drives sustainable growth. BIGContacts offers exactly that—a dynamic CRM solution designed to streamline data tracking and reporting. With its customizable reports and real-time visibility into key performance indicators, you can focus on the metrics that matter most to your business.
The best part? BIGContacts offers a forever-free plan, making it an accessible solution for teams of all sizes. You can even experience its full capabilities by signing up for a free trial today. Revolutionize your approach to customer management and unlock data-driven success with BIGContacts.
CRM Metrics: FAQs

How often should organizations review and analyze CRM metrics for optimal decision-making?
Organizations should review and analyze CRM metrics at least monthly for optimal decision-making. This gives you enough time to spot trends and adjust strategies without overwhelming your team. For fast-changing industries or campaigns, weekly reviews can help you stay agile. Regular analysis ensures you're always on top of performance and ready to make informed decisions.
How can CRM metrics improve your understanding of your customers in business?
CRM metrics help you get a clear picture of what your customers want and need. By tracking data like buying habits, feedback, and engagement, you can spot trends and tailor your approach. It’s like having a roadmap to build stronger relationships, improve satisfaction, and make smarter decisions that benefit both your customers and your business.
FREE. All Features. FOREVER!
Try our Forever FREE account with all premium features!